
80 PLUS® Certification Program FAQs
Have questions about 80 PLUS® ? You're in the right place. Find information on what the different PSU energy efficiency ratings mean, the value of getting your product certified, how our testing protocols work, and the steps to get your product certified.
Popular Questions
The input voltage measurement is taken as closely as possible to the unit's input connector. A C19 and C14 extractable cable is tailored for common input connectors to achieve this. This specialized input power cable is equipped with voltage measurement leads affixed to the input voltage wires within one-and-a-half-inch proximity to the unit's input power mating connector, as shown in Figure 1 and Figure 2.
Figure 1: C19 Open Connector 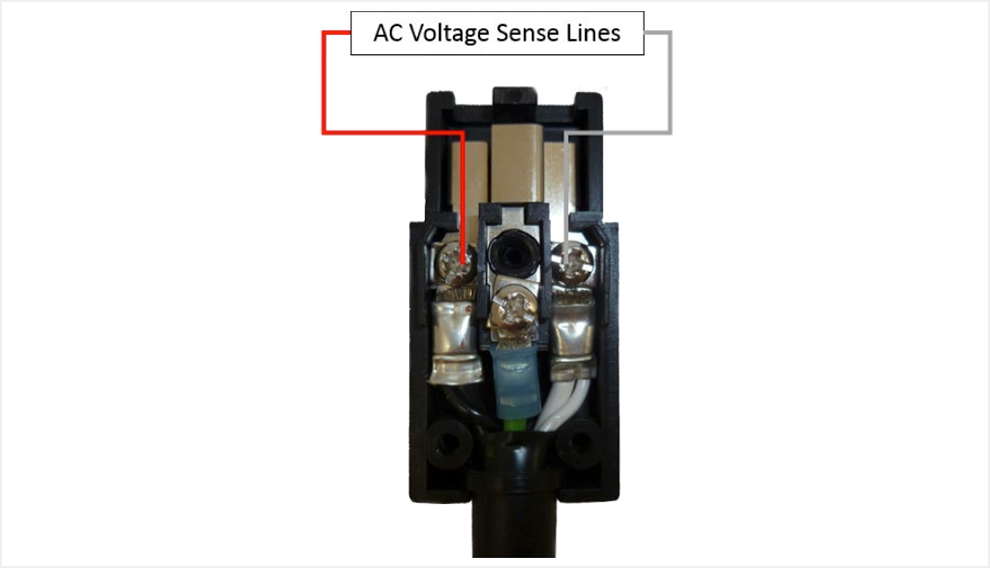 | Figure 2: C14 Open Connector 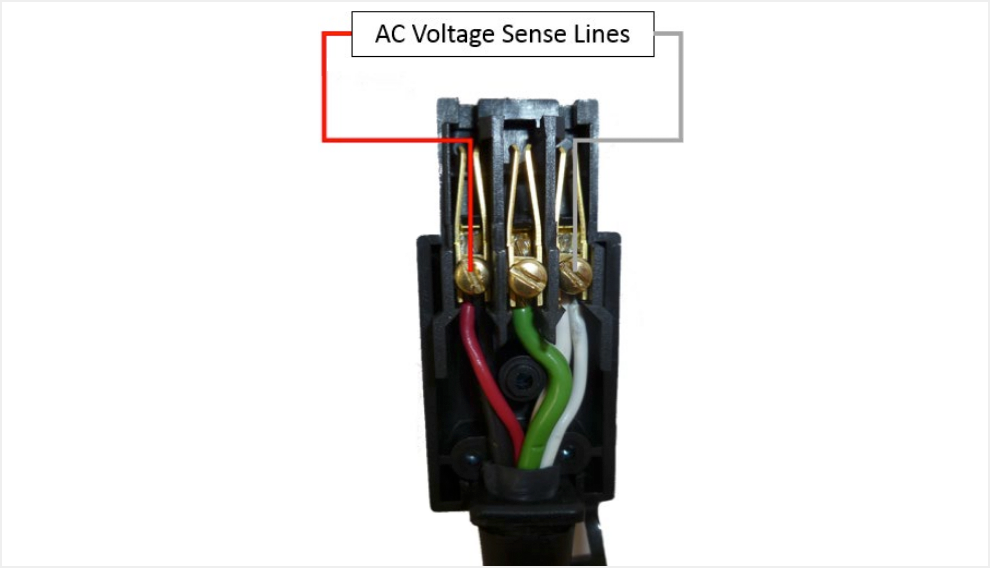 |
230V EU Internal, Non-Redundant tests are conducted at 50 Hz. All other tests-115V Internal Non-Redundant, and 230V & 277/480V Internal Redundant (for North American servers) are conducted at 60 Hz, and 380V DC Internal Redundant- is conducted at 0 Hz
We use three high-performance, programmable 3-phase AC power sources for testing:
- Ametek MX45-3PI-480-HV
- California Instruments Tahoe TA0045A1E1-01A00A
- Chroma 61845
Each of these units is a 45 kVA voltage source capable of delivering stable and programmable AC power. These sources are used to test a wide range of input conditions across all product types, including 115V and 230V EU internal non-redundant power supplies, as well as 230V, 277V/480V, and 380V DC internal redundant systems. They support full compliance testing by simulating global input voltages and power conditions.
To accurately measure output voltage for desktop power supplies tested at both 115V and 230V EU input, we connect sense leads from the Chroma 63640-150-60 and 63610-80-20 electronic load banks directly to the rear of the output connectors using piercing probes. These probes interface with the back of the cable connector that connects to the load, ensuring voltage is measured as close to the load input as possible. Measurements are logged every second during the 15 minute steady-state period for each load condition. Figure 3 below shows an example of a single probe placement of a connector and highlights the monitoring points noted on the test board.
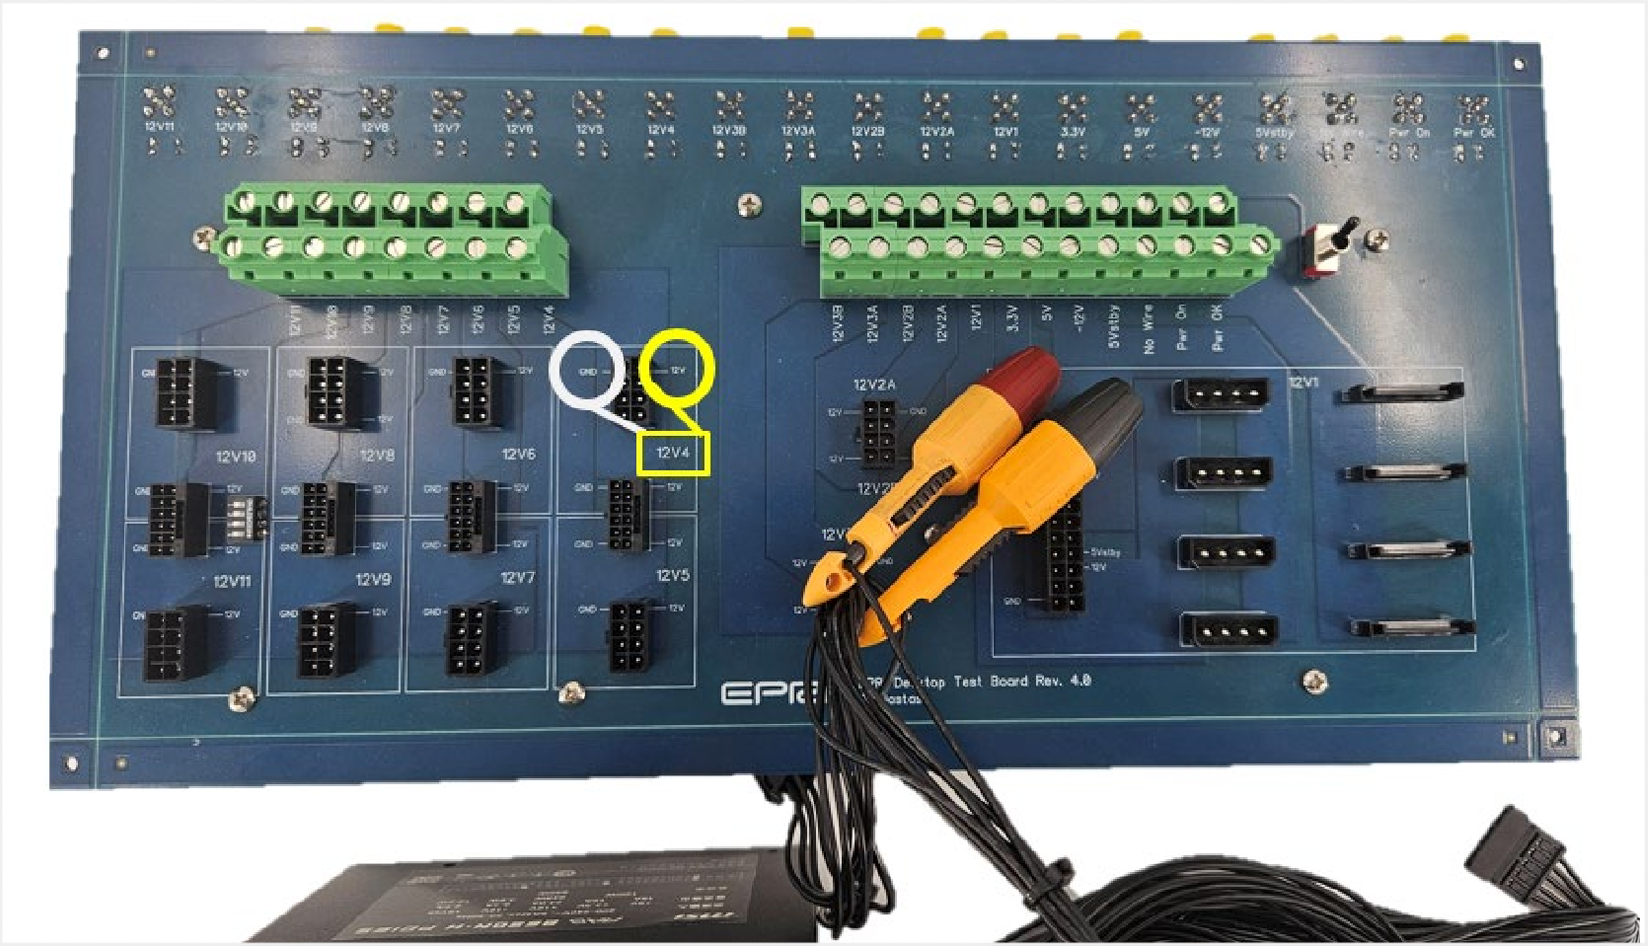 Figure 3: Insulated Piercing Probe to Measure the Multi-Output Voltages of Desktop Power Supply |
The same procedure is followed for 230V & 277V Internal Redundant, 115V Industrial, and 380V DC test power supplies unless a custom interface board is supplied with the unit. If a custom interface board is provided, test points must be incorporated to measure the output voltage and return ground directly when they exit the mating connector on the load side of the unit. Test points should be marked on the test board or in photos accompanying the submitted units, as shown in Figure 4.
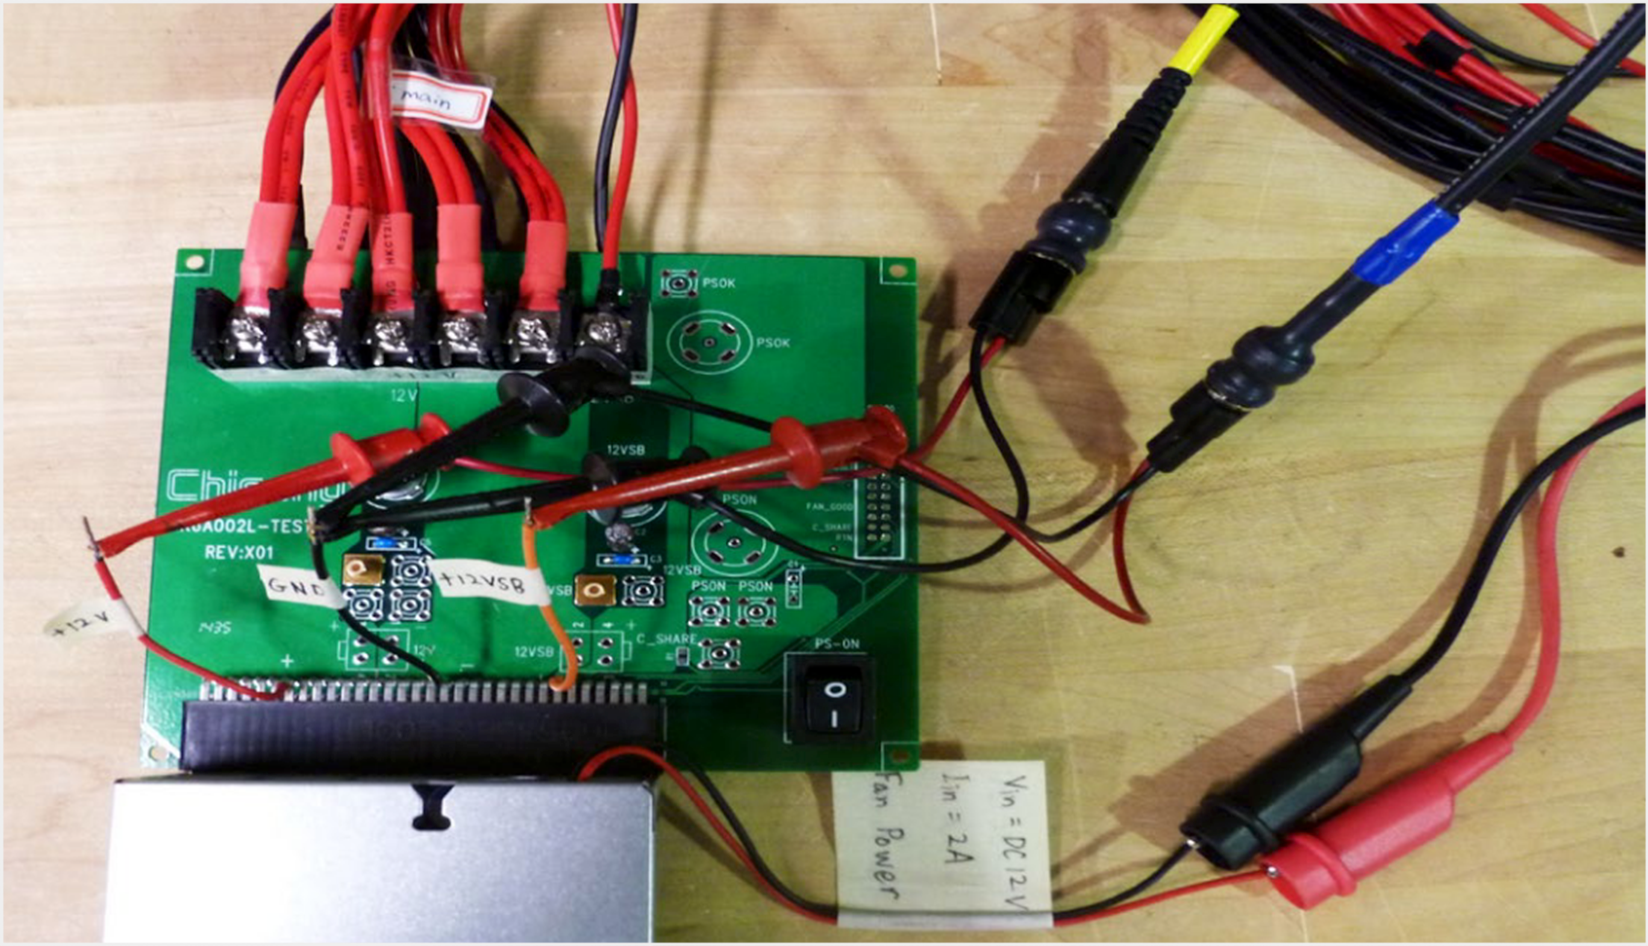 Figure 4: Sense Line, when provided, is used to measure the output voltages |
For the 115V and 230V EU Internal Non-Redundant test bench, the Yokogawa WT5000E is employed to monitor and measure various input parameters, including input voltage (V), input current (A), input frequency (Hz), input power (Watts), power factor (λ), and input current total harmonic distortion (THD %)
Figure 5 below is Yokogawa WT5000. It monitors the input parameters with no filters applied to the power analyzer. An exponential average rate of 32 samples is enabled with a refresh rate of 200 milliseconds. A 1-Phase 2-Wire wiring configuration is used, with the voltage and current range set to Auto and the measuring mode set to RMS. The instrument is set in normal measurement mode for harmonics measurements, with a maximum order set to 50 using the IEC formula, 1/Total.
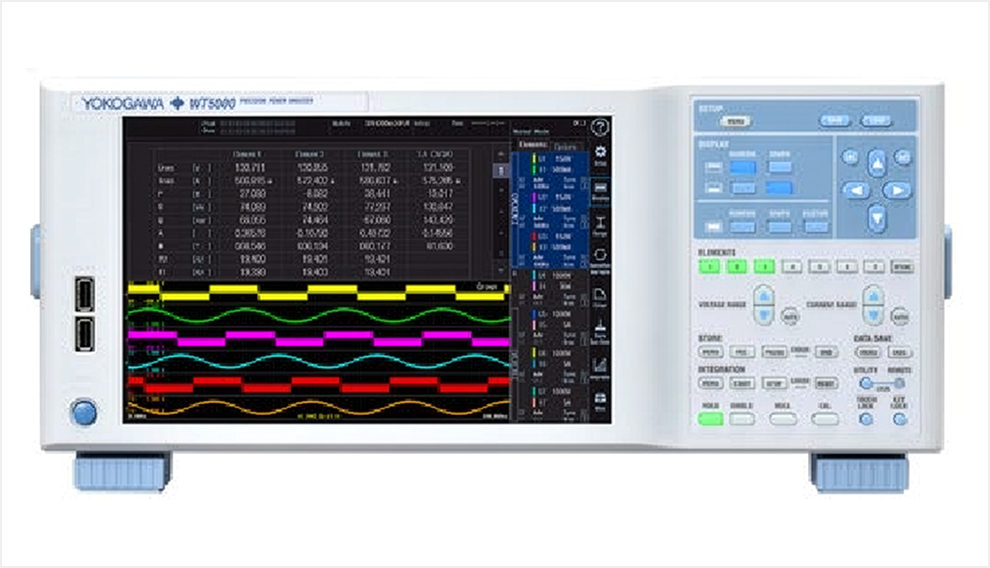 Figure 5: Yokogawa WT5000 Power Analyzer | 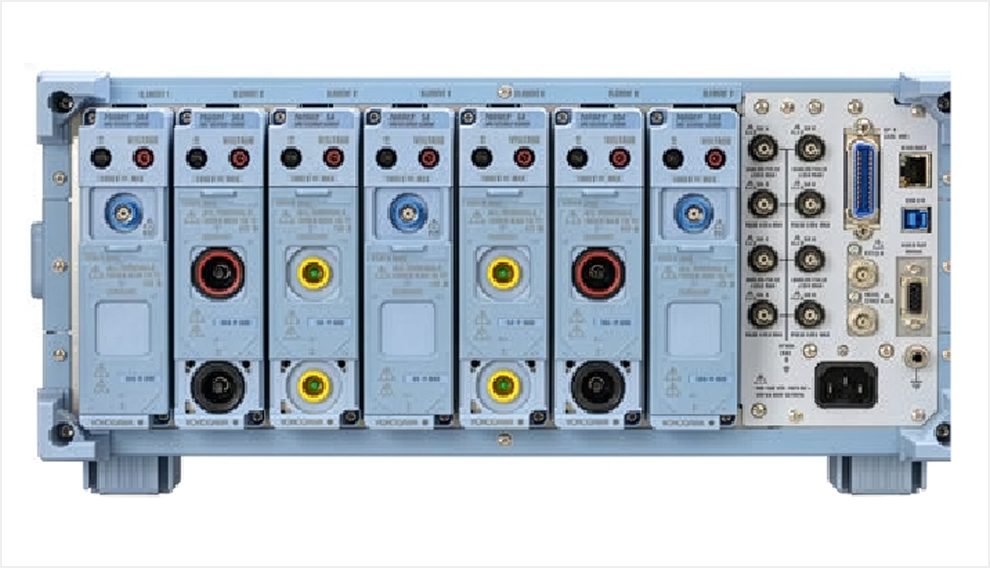 Figure 5: Yokogawa WT5000 Power Analyzer |
In the context of the 115V and 230V EU Internal Non-Redundant test bench, the monitoring and measurement of output parameters are carried out using the Chroma 63640-150-60 and 63610-80-20 DC load banks shown in Figure 6. These measurements are taken at 1 second interval during the 15-minute interval per load set point. The recorded parameters encompass output voltage (V), output current (A), and output power (Watts).
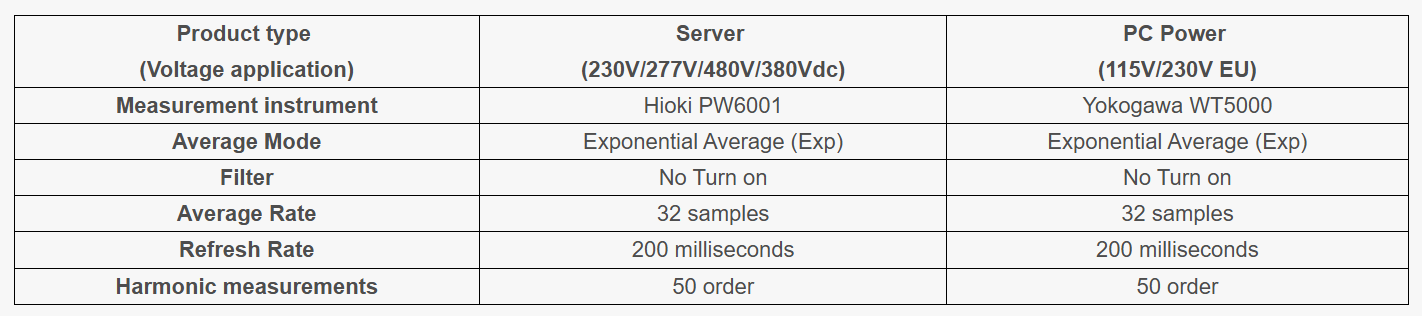
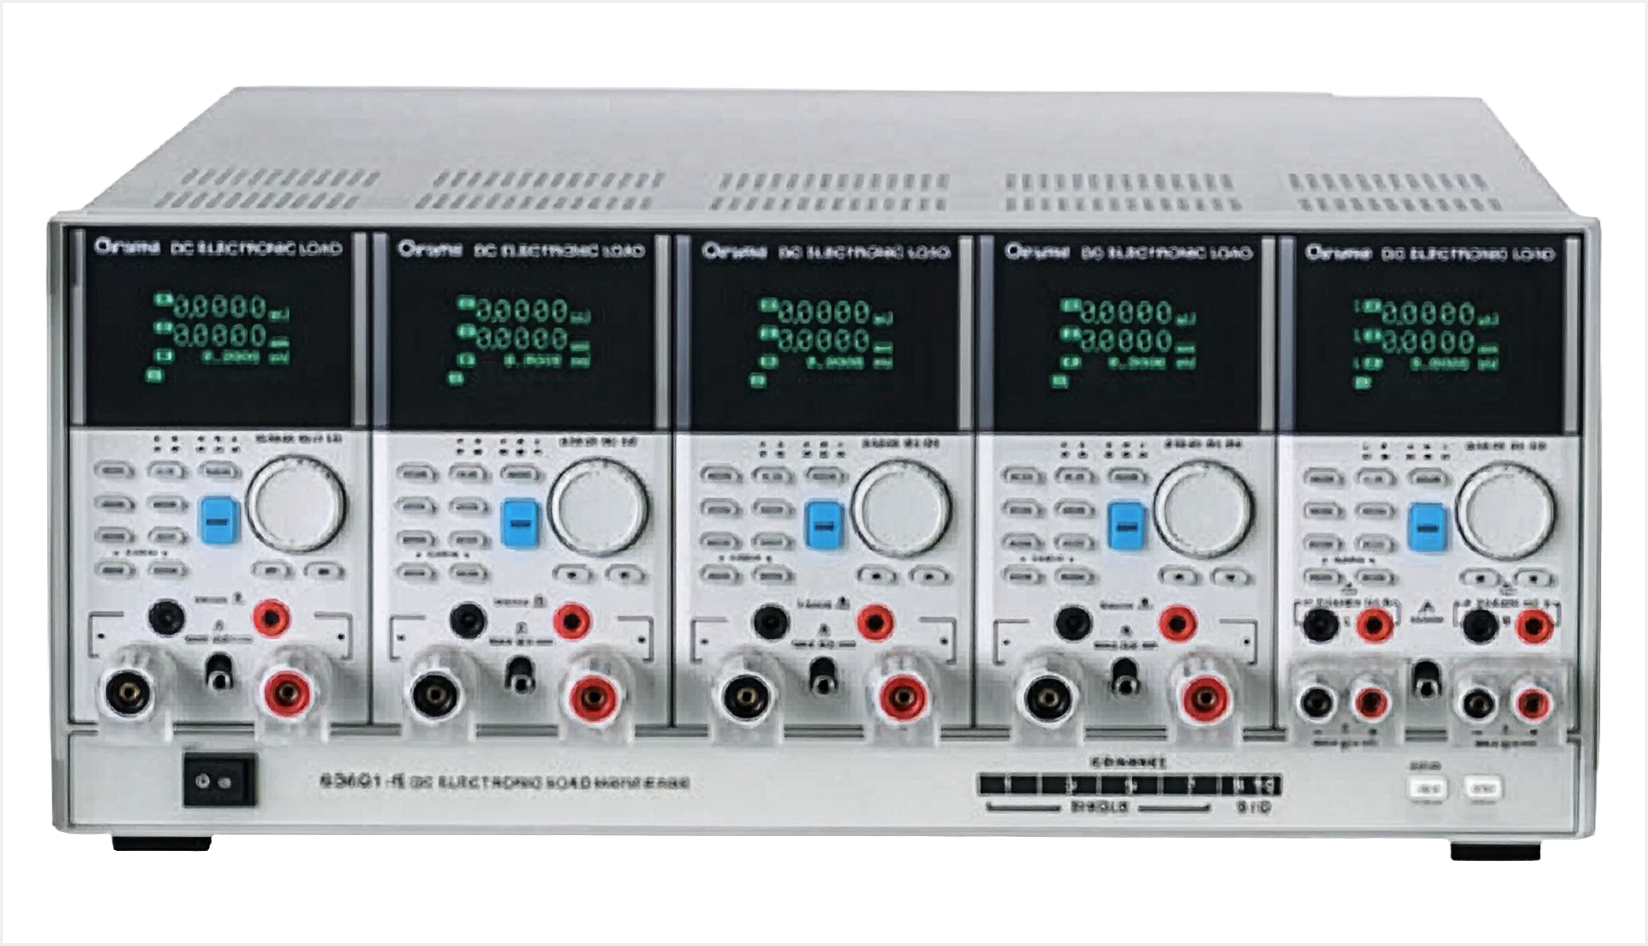 Figure 6: Chroma 63640-150-60 & 63610-80-20 DC Load Banks |
230V, 277/480V, and 380V DC Internal Redundant power supply; the Hioki PW6001-16 monitors and measures a range of input parameters. These parameters encompass input voltage (V), input current (A), input frequency (Hz), input power (Watts), power factor (λ), and input current total harmonic distortion (THD %). Additionally, it is used to monitor output and external fan parameters, including voltage (V), current (A), and output power (Watts).
Specifically, for the 230V Internal Redundant, 115V Industrial, and 380V DC test benches, the Hioki PW6001 is employed. Filters are not applied to the power analyzer, and data recorded rate is set to 200 milliseconds. The wiring configuration is 1-Phase 2-Wire, with voltage and current ranges set to Autoscale. The measuring mode is RMS for the AC Input channel and DC mode for the DC output channels. For harmonics, the maximum order is configured to 50 using the IEC formula 1/Total.
Regarding output current measurement for the test bench, Hioki current transformers are actively used, as depicted in Figure 7. The selection of current transformers depends on the maximum rated current of the power supply rail, which can be 20A, 50A, 200A, 500A, or 1000A. Before each test, each current transformer undergoes demagnetization and zero adjustment.
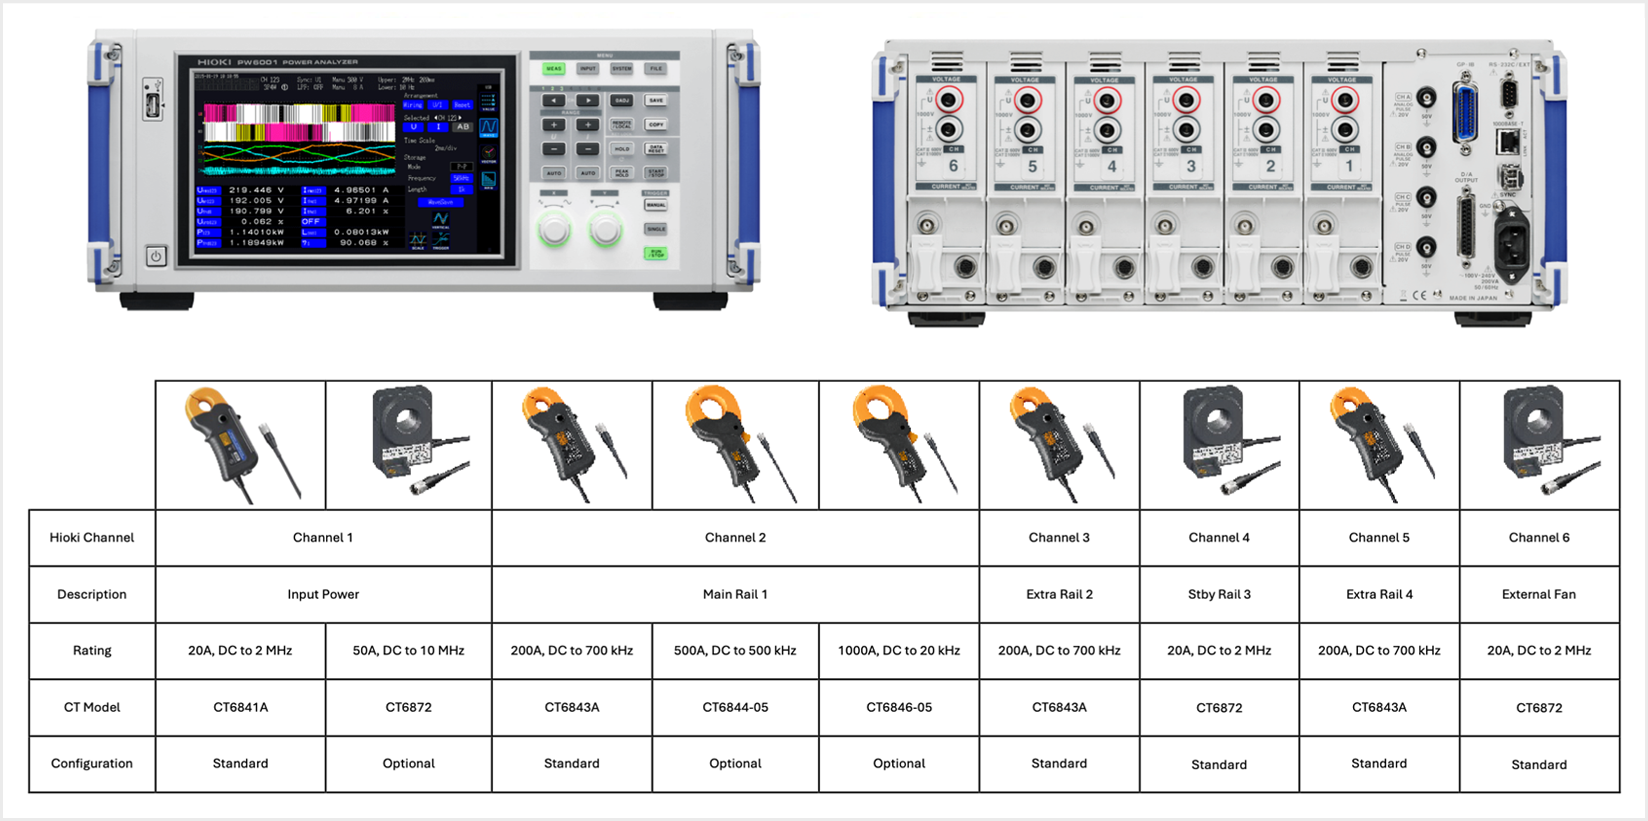 Figure 7: Hioki PW6001-16 Power Analyzer and Current Transformer Sensors |
A LISN (Line Impedance Stabilization Network) and 1uF capacitor was added to the Generalized Test Protocol for Calculating the Energy Efficiency of Internal AC-DC and DC-DC Power Supplies (Version 6.7.2). The addition of the 50µH LISN provides a known and stable input impedance when measuring the input power factor of very lightly loaded power supplies (below 20% loading) while the 1uF capacitor is used as a low pass filter. Testing at several labs, including OEM labs, showed that the power factor readings were much more repeatable when using the LISN and 1uF capacitor.
The ratings shown on the label of the test unit are entered into an Excel worksheet that performs a calculation based on the algorithm explained in the Generalized Test Protocol for Calculating the Energy Efficiency of Internal AC-DC and DC-DC Power Supplies (Version 6.7.2), Paragraph 6.1.1 Proportional allocation method for loading multiple and single-output AC-DC and DC-DC power supplies.
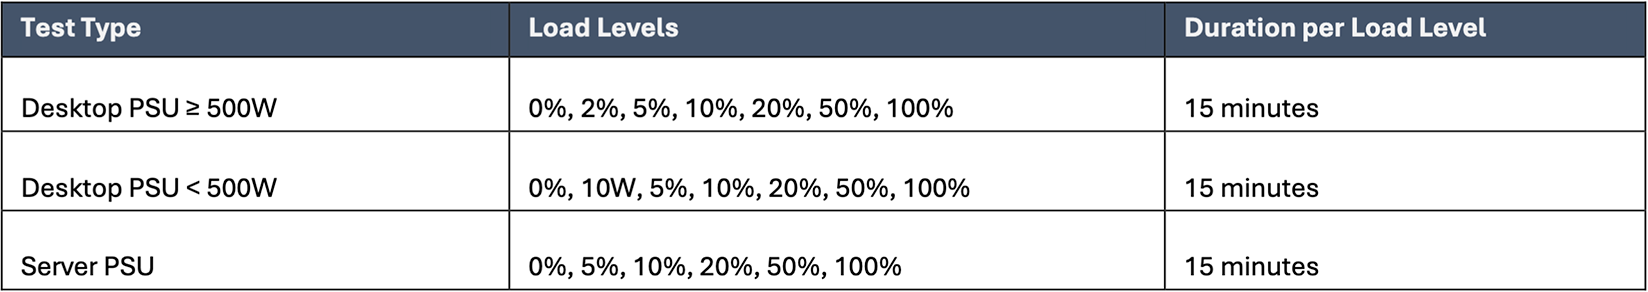
Each Unit Under Test (UUT) begins the test sequence at 0% load. For desktop power supplies, the next test point is at 2% load. However, if the desktop PSU is rated below 500 watts, this step is replaced with a fixed 10-watt load. The sequence then continues at 5%, 10%, 20%, 50%, and 100% load.
For server power supplies, the full test sequence includes 0%, 5%, 10%, 20%, 50%, and 100% load levels. At each load point, the unit is operated for a duration of 15 minutes prior to data collection as shown in Error! Reference source not found..
Table 1: Loading Sequence
The AC source and DC load banks are manually set and adjusted at the initial start of the 15-minute interval. Adjustments of the AC source or loads are no longer adjusted during the 15-minute interval while the unit is in operation.
If a unit fails to meet any 80 PLUS® criteria for certification, the test for that unit is terminated. The second unit is then tested at the specific condition of failure. If the second unit passes, the second unit is tested thoroughly, and data is used for the report. The test is terminated if the second unit fails, and a report is issued with recorded failure data.
The test equipment used can have a significant impact on measurements. In most cases, the difference will be due to input power measurement. The accuracy of the input power measurement is dependent on the power factor of the unit under test, as well as the base accuracy of the measuring equipment. If all equipment and setups were identical, it is still possible to have a difference in readings of twice the stated accuracy. For example, if a power analyzer has an accuracy of ± 0.1%, the worst-case difference could be as much as 0.2%. The Hioki PW6001 power analyzer used by 80 PLUS® has an Active power base accuracy of ± 0.02% of the reading plus 0.03% of the range + current sensor accuracy, and the Yokogawa WT5000 has a base accuracy of ± 0.01% of the reading + 0.02% of the range.
When a unit comes within 0.5% of the next higher badge level on any loading parameter, the test of that unit is completed, and a second unit is tested at the failed point. Should the second unit pass the next level, the second unit is thoroughly tested, and that data is used for the 80 PLUS® report. If the second unit fails to meet the higher level, then the first unit's data is used to create the 80 PLUS® report.
We test two desktop power supply samples in parallel. Sample 1 is actively loaded at 0%, 2%/10W, 5%, 10%, 20%, 50%, and 100% load levels. Sample 2 is tested in standby mode according to ALPM and ERP Lot 3 & 6 requirements. This setup allows us to capture performance in both active and low-power states within a single test sequence.
Open frame units can be tested. The unit must be connectorized, and if it requires specific cooling air, instructions to provide that air must be included with the unit. If an air plenum is required, it must be provided with the unit on submittal.
In the testing process, most, if not all, power supply connectors are utilized and connected to the load test fixture. Various power supply configurations may have a multitude of connectors. For instance, the 80 PLUS® desktop test board provides several connectors for connecting loads, including:
Table 2: Available Connectors for Desktop Power Supplies
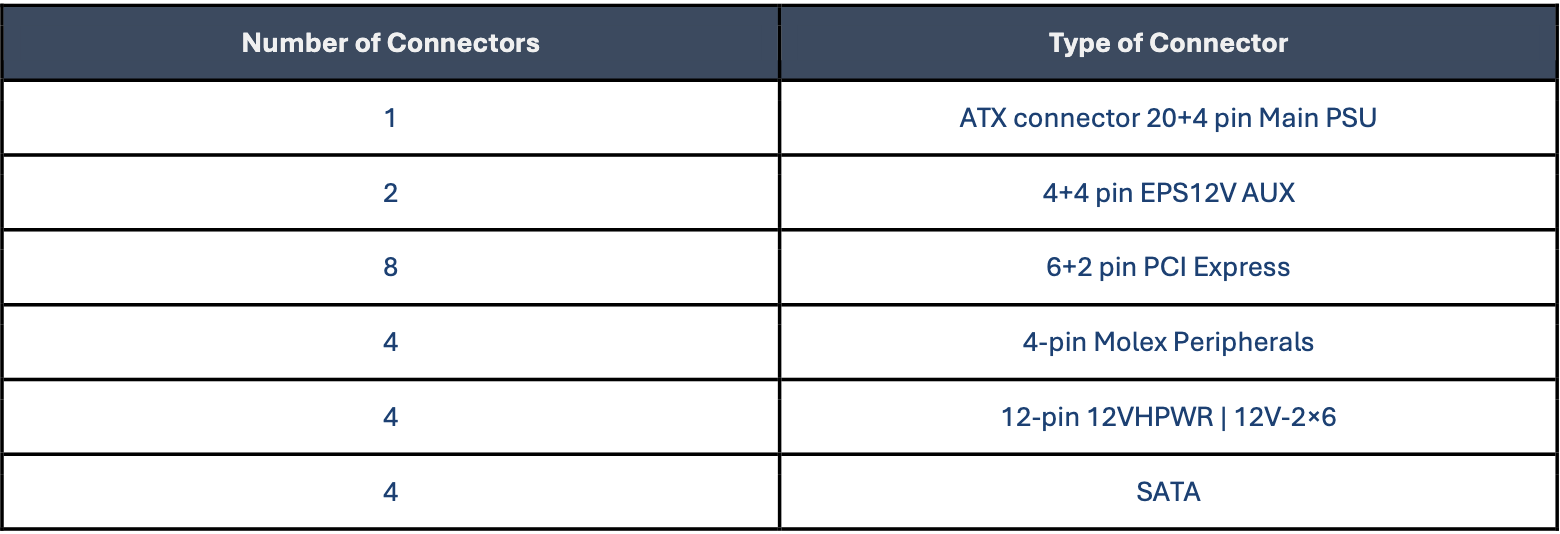
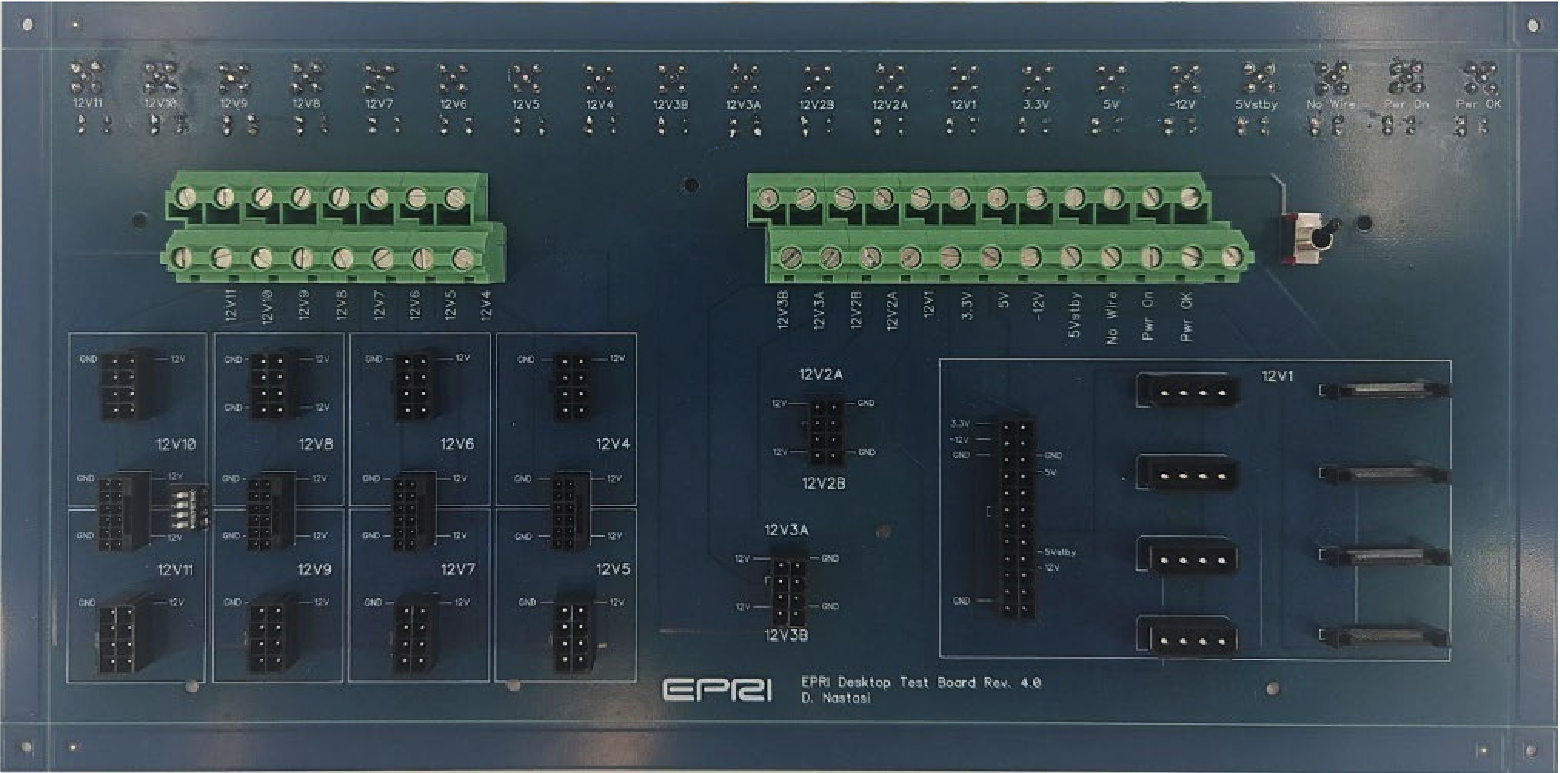 Figure 8: 80 PLUS® Test Board Interface |
We request the manufacturer to extract the fan power leads for 230V, 277V/480V, & 380VDC Internal Redundant Data Center power supplies. The external power source should be appropriately labeled with polarity and voltage specifications. Please refer to the attached photo for proper labeling of external fan/cooling power.
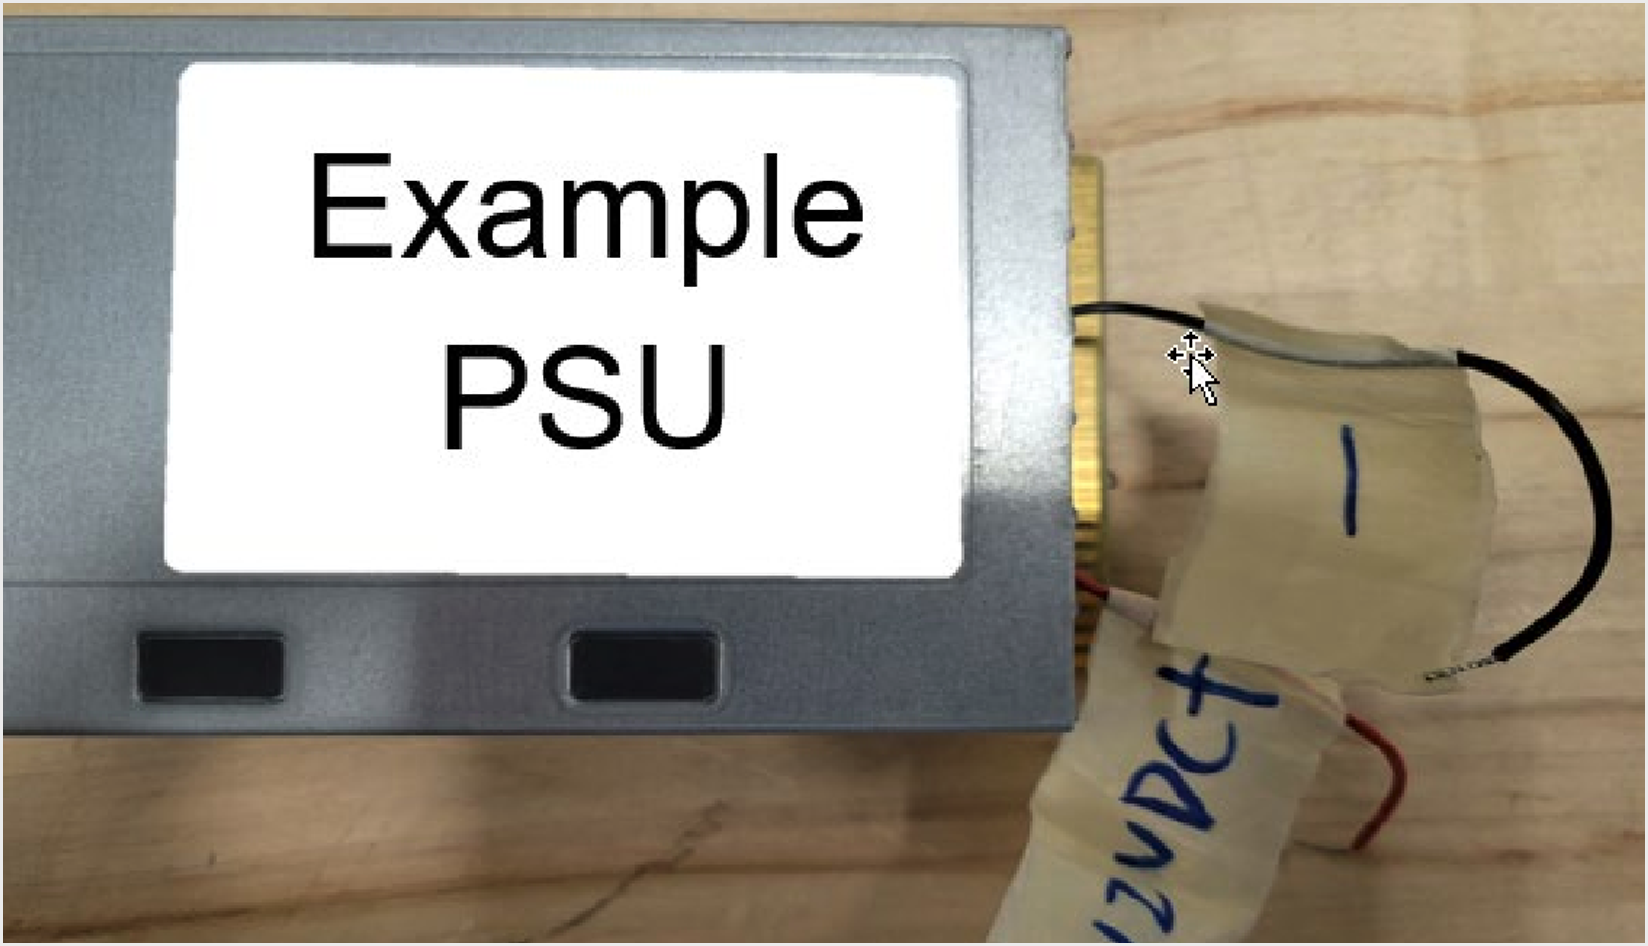 Figure 9: External Fan Power Labeled |
Our desktop test bench is equipped to test units with a power capacity upwards to a maximum of about 3kW. This robust capability allows us to support a broad spectrum of desktop units, offering comprehensive testing for a variety of models and specifications to meet diverse testing needs.
Input Line Impedance Stabilization Network (LISN) Rating Limitation:
The LISN is single-phase and is rated for 20A.
- At 115V, the LISN can support up to approximately 2.3kW.
- At 230V, the capacity increases to about 4.6kW.
Load Bank Power Limitations:
The diagram below Q19 includes a table of the power limitations of each load bank we have available. These limitations are essential to consider when configuring your tests to ensure that the load banks can adequately support the power requirements of the server units being tested.
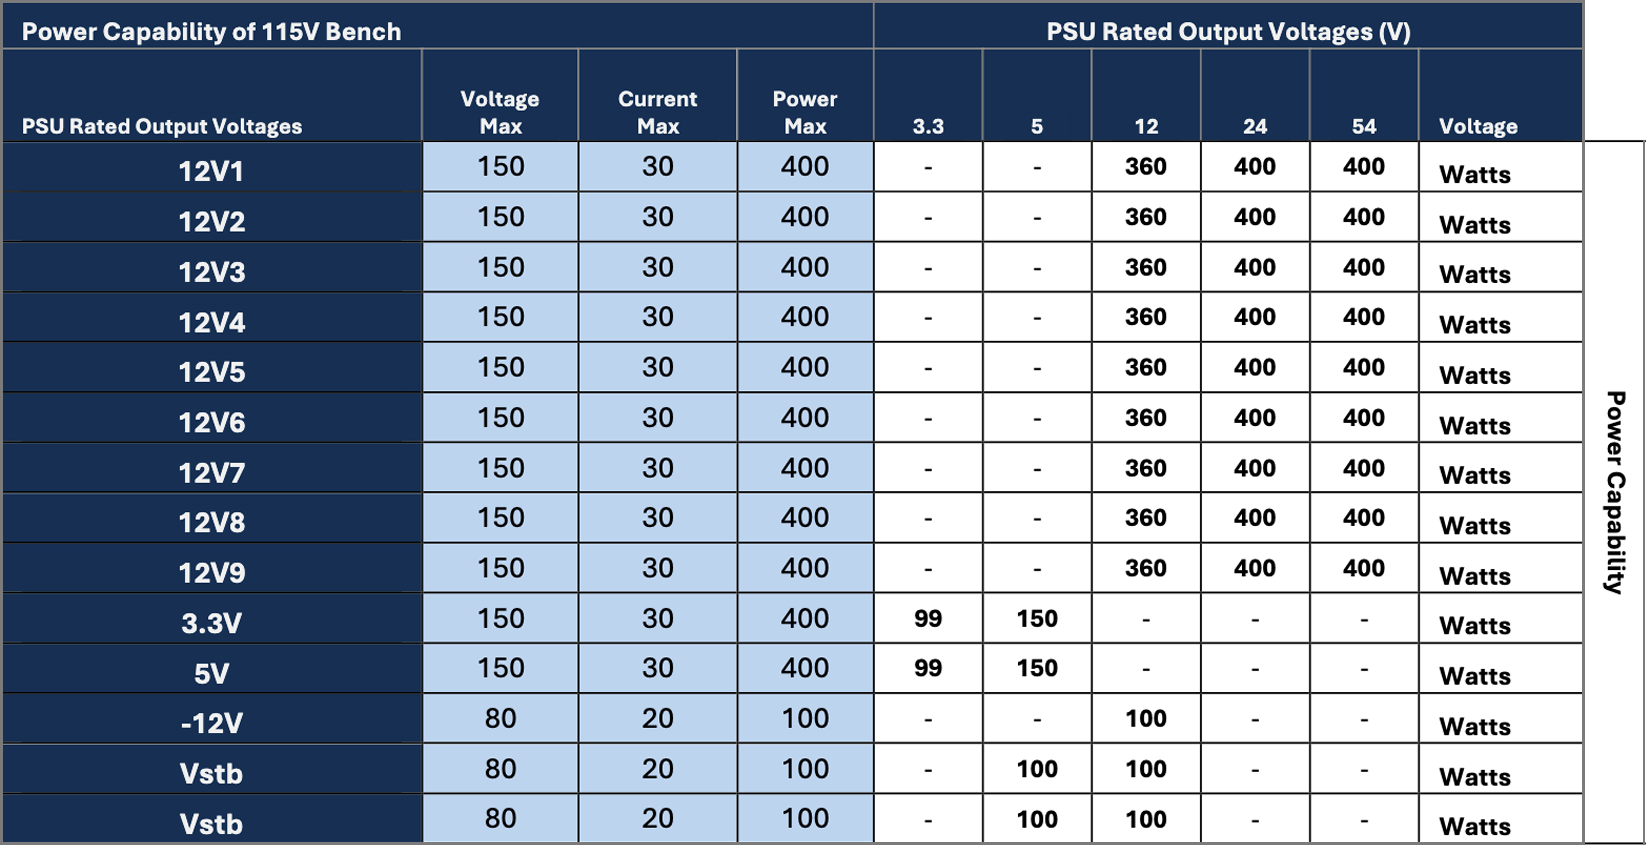
No, not all power supplies adhere to the same loading criteria. The capability of our load bank setup to test these supplies varies depending on several factors, including the output voltage and current ratings of the unit being tested. It's important to understand that different output voltages can affect both the power and current capabilities of our testing process
To help you understand how the output voltage impacts our testing capabilities, we've provided a table below. This table outlines the power capabilities of our load bank setup at various output voltage levels.
Table 3: Desktop Load Bank Power Capabilities
Our Server Test Bench is designed to accommodate a wide range of testing scenarios with an input source capacity of up to 45kVA/45kW. However, it's important to note that there are specific limitations related to the Line Impedance Stabilization Network (LISN) and the total power that can be distributed across the phases during testing.
Input Source Limitation:
The Server Test Bench can handle an input source of up to 45kVA/45kW, providing robust testing capabilities for a variety of server units.
LISN Rating Limitation:
Our LISN’s current rating is 50A per phase. This translates to approximately ~11.5kW per phase, culminating in a total of around 32kW across all phases. This limitation is crucial for planning your test setup, especially when testing high-power server units.
Load Bank Power Limitations:
Figure 10 includes a red box highlighting the power limitations of each load bank we have available. These limitations are essential to consider when configuring your tests to ensure that the load banks can adequately support the power requirements of the server units being tested.
Understanding these limitations is vital for effectively planning and conducting your server tests. The LISN rating, in particular, restricts the maximum power that can be tested per phase, which may require adjustments to your testing setup or the distribution of power across different phases to stay within the safe operating limits of the test bench and load banks.
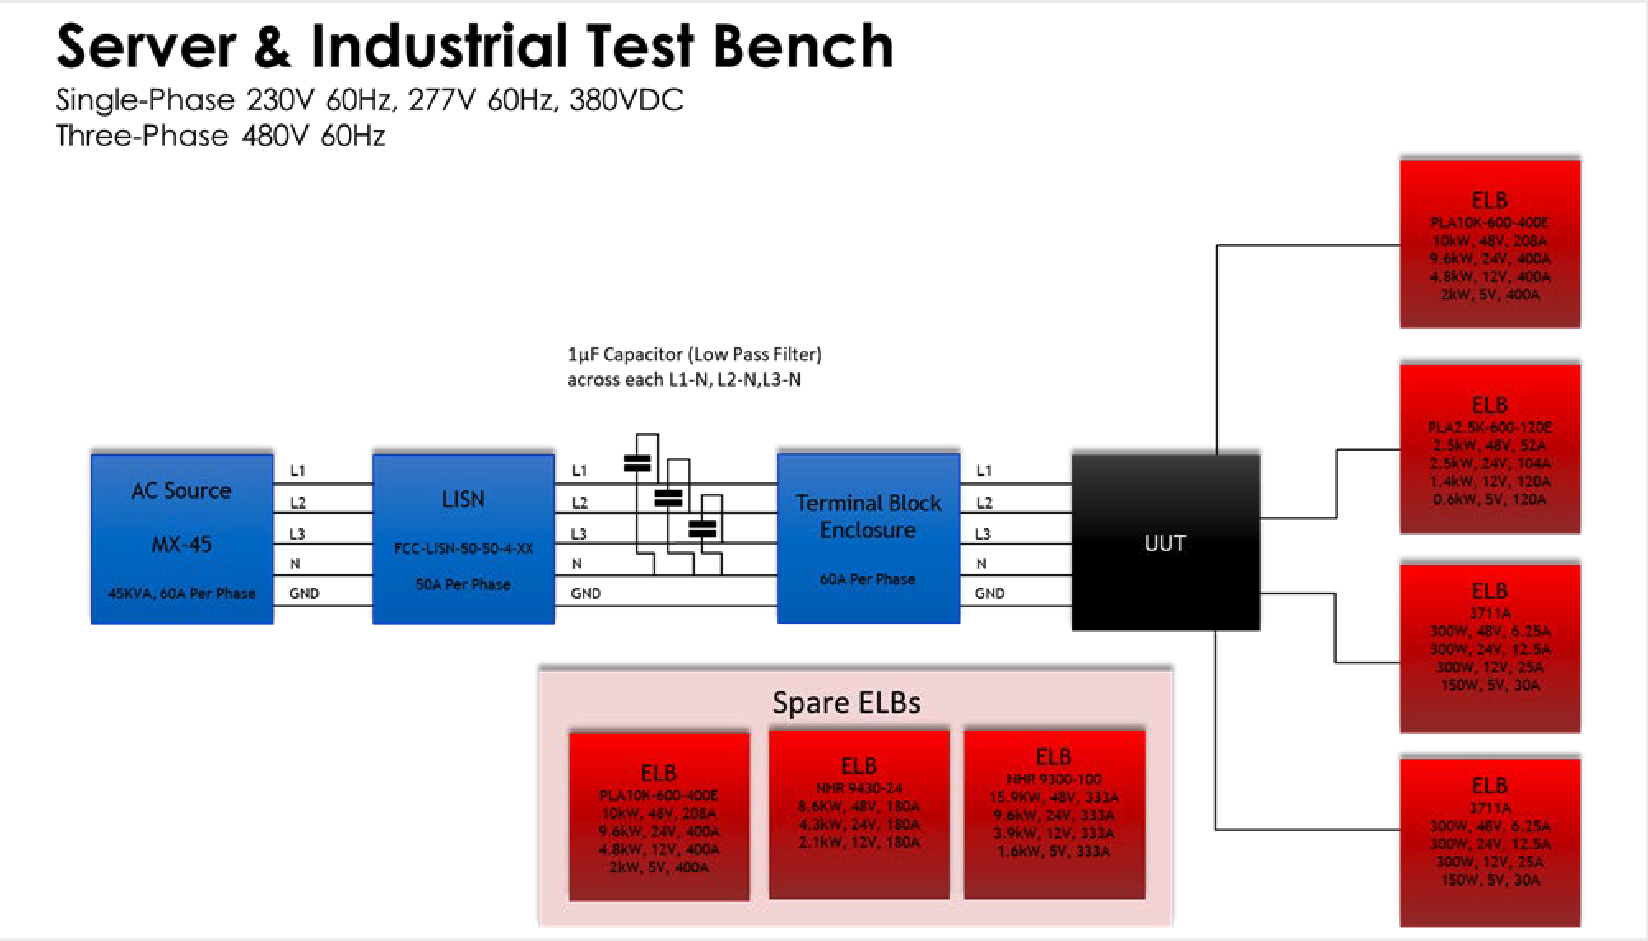 Figure 10: Server and Industrial Test Bench Line Diagram with Load Bank Capabilities |
If your desktop or server's power requirements exceed the limitations of our test bench, we recommend contacting our support team to discuss alternative testing strategies. In some cases, it may be possible to adjust the test setup or use multiple phases strategically to accommodate higher power requirements. Our team is here to help you find the best solution for your testing needs.
The Order Application:
From the order application submitted by the manufacturer, we use the following in the report:
- Product Information: Used to determine what voltage the PSU is to be tested at.
- Brand Name: The name used in the report as the “Manufacturer” name.
- Model Name: The name used in the report for the “Model Number” name.
- Form Factor: The description used to identify the “Type” topology of the PSU in the report.
- Wattage: The value is used in the report as the rated output power. However, it is not used as the rated wattage of the power supply when determining the loading guidelines. The power supply label will determine this value.
The Power Supply Label:
From the power supply label itself, we extract the following information for testing:
- Input-rated Specifications Ratings: These include the voltage, current, and frequency ratings that the power supply can safely handle and operate.
- Serial Number: A unique identifier for the power supply, used for tracking and record-keeping purposes
- Output Voltage, Current, and Power Rating: These ratings specify the power supply's performance on the output side. This information is crucial for determining the actual output voltage, max current, and rated wattage of the power supply and is used to calculate the loading guidelines of the power supply.
Note: Max DC Wattage or Peak Wattage is not used as the rated wattage of the power supply. The power supply should clearly display what the rated wattage of the power supply is on the label.
Reference: Generalized Test Protocol for Calculating the Energy Efficiency of Internal Ac-Dc and Dc-Dc Power Supplies, section 6.1.1 Proportional allocation method for loading multiple and single-output ac- dc and dc-dc power supplies.
For this specific power supply, we have a sub-group current limited factor in the railing system
 Figure 11: Multi Rail with Sub-Group Current Limits Power Supply Label |
Current Ratings:
- +12V1A: 18 A & +12V2A: 18A with a Max Total Current rating 18 A
- +12VB: 18 A
- +12VC: 13 A
Table 4: Output Variable Label with Sub-Group Current Limits and Multi-Rail Output Voltage Bus

Step 1: Calculate derating factors for voltage rail or sub-groups rails as shown in below
Derating for 12V1A and 12V2A has a max current limitation of 18A, so you would use the following equation and for this example: Derating1 for both 12V1A & 12V2A = 0.5

12VB has a max current of 18A, an equation you would use for this. Derating1 = 1

12VC has a max current of 13A, an equation you would use for this. Derating1 = 1

If the derating factor DS ≥ 1, then it is clear that when the subgroup is loaded to the rated dc output currents, the subgroup rated output powers will not be exceeded and there is no need for derating. However, if one or more DS factors are less than 1 then the subgroup power will be exceeded if the outputs are loaded to their full output currents and there is a need for derating
Step 2: There is also a need to check whether the sum of the subgroup maximum rated powers is greater than the total maximum power rating of the power supply (PT). If the sum of the subgroup maximum rated powers is greater than the overall power rating of the power supply then a second derating factor DT must be applied. This factor is calculated as shown below: If DT ≥ 1 then no derating is needed. If DT < 1 then the derating for each of the outputs has to be applied and is shown below.

The total derating factor, Dt = 0.6122
12VA1 rail: 18A x 0.5 (Derating1) x 0.6122 (Dt) x 100% (load)= 5.510 A
12VA2 rail: 18A x 0.5 (Derating1) x 0.6122 (Dt) x 100% (load)= 5.510 A
12VB rail: 18A x 1 (Derating1) x 0.6122 (Dt) x 100% (load)= 11.020 A
12VC rail: 13A x 1 (Derating1) x 0.6122 (Dt) x 100% (load)= 7.959 A
Here is a screenshot of what this specific loading would be at each loading point.
 Figure 12: Loading Guidelines for Multi-Rail System with Sub Group Current Limits |
Please reference the Test Protocol for more information. Generalized Test Protocol for Calculating the Energy Efficiency of Internal Ac-Dc and Dc-Dc Power Supplies, section 6.1.1 Proportional allocation method for loading multiple and singleoutput ac- dc and dc-dc power supplies
Given:
- Overall rated DC output power: 1600W @ 230V, if we were to test this at 115V, rated wattage is 1000W. For this example we will have the rating at 1600W
Current Ratings:
- +55V: 29.1 A
- +12V: 33.3 A
 Figure 13: Multi-Rail Power Supply Label |
Table 5: Output Variable Labels with Multi-Rail Output Voltage Bus

Step 1: Calculate derating factors DS1 to DS6 for each of the subgroups as shown in Eq. 6-4.
55V has a max current of 29.1A, an equation you would use for this. Derating = 1

12V has a max current of 33.34A, an equation you would use for this. Derating = 1

If the derating factor DS ≥ 1, then it is clear that when the subgroup is loaded to the rated dc output currents, the subgroup rated output powers will not be exceeded and there is no need for derating. However, if one or more DS factors are less than 1 then the subgroup power will be exceeded if the outputs are loaded to their full output currents and there is a need for derating
Step 2: There is also a need to check whether the sum of the subgroup maximum rated powers is greater than the total maximum power rating of the power supply (PT). If the sum of the subgroup maximum rated powers is greater than the overall power rating of the power supply then a second derating factor DT must be applied. This factor is calculated as shown below: If DT ≥ 1 then no derating is needed. If DT < 1 then the derating for each of the outputs has to be applied and is shown below.
For example,

The total derating factor, Dt = 0.79996
55V rail: 29.1 A x 0.79996 Dt x 100% (load)= 23.279
12V rail: 33.34 A x 0.79996 Dt x 100% (load) = 26.639
Here is a screenshot of what this specific loading would be at each loading point.
 Figure 14: Loading Guidelines for Multi-Rail |
We take pride in our rigorous data capture process, ensuring that every aspect of power supply performance is thoroughly monitored. Here’s an overview of how our data collection works, broken down by different measurement types and their corresponding data points:
- Servers:
- Input/Output (Hioki): Captured every 250ms over a 15-minute period, resulting in 3,600 samples per load. With 28 parameters (Voltage, Current, Power Factor, Watts, Voltage Peak, Vthd, Ithd, Frequency, and Efficiency) captured per sample, this results in 100,800 data points per load, totaling 621,000 data points across six load points.
- Input Waveform @ 50% Load: Captured at 50ms, yielding 100,000 samples wavefrom of voltage and current waveform, totaling 200,000 data points.
- Environment (TSI Alnor): Captured every 1 second over 15 minutes, resulting in 900 samples per load. Temperature, Humidity, and Air Flow parameters captured, this totals 2,700 data points per load and 16,200 data points across six load points.
Total for Servers:
We collect a total of 837,200 data points over the full testing process for servers.
- Desktop:
- Input (Yokogawa): Captured every 200ms over a 15-minute period, resulting in 4,500 samples per load. With 43 parameters (Voltage, Current, Power Factor, Watts, Voltage Peak, Vthd, Ithd, Frequency, and Efficiency) captured per sample, this results in 193,500 data points per load, totaling 1,161,000 data points across six load points
- Output (Chroma): Captured every 1 second over a 15-minute period, resulting in 900 samples per load. With 51 parameters (Voltage, Current, Power) captured per sample, this results in 45,900 data points per load and 275,400 data points across six load points.
- Input Waveform @ 50% Load: Captured at 50ms, yielding 1,000 samples with voltage and current waveform parameters per sample, totaling 2,000 data points.
- Environment (TSI Alnor): Captured every 1 second over 15 minutes, resulting in 900 samples per load. Temperature, Humidity, and Air Flow parameters captured, this totals 2,700 data points per load and 16,200 data points across six load points.
Total for Desktop:
We collect a total of 1,454,600 data points over the full testing process for desktop power supplies.
The 80 PLUS® certification program does not specify pass/fail thresholds for Input Total Harmonic Distortion (ITHD). ITHD is measured across various load conditions and reported in the test data set to assess power quality. The testing methodology follows IEC 62301 for general test conditions and standby power measurements, with harmonic measurements, including ITHD, conducted per IEC 61000-4-7 to ensure accurate and consistent harmonic distortion analysis. These measurements support broader power quality evaluation, though compliance with harmonic limits (e.g., IEC 61000-3-2) may be required in certain markets outside 80 PLUS® requirements.
Yes, models that do not meet the 80 PLUS® performance specification during their first evaluation may be modified and resubmitted for testing. Each resubmission is treated as a new application and requires the standard certification fee. We recommend a thorough engineering review to address the specific efficiency or power factor shortfalls identified in the initial test report before beginning a new certification attempt.